Avalanche Reporting Tool
Northwest Avalanche Center
The Challenge
How can we view all the avalanche incidences and data collected over the past 60 years? B.C. Adventure Guides, along with NWAC, approached Integral GIS with a request to create a user-friendly interface for them to upload and visualize all the avalanche data they had compiled.
Our Insight
B.C. Adventure Guides and other field researchers have compiled avalanche report data spanning over four decades in spreadsheets and wanted a simple way to view their information on a map, with the ability to overlay various spatial and data layers.
Our Approach
We developed an ArcGIS Online Web App to view, search, and report avalanche data in the Pacific Northwest region.
Categories
- ArcGIS Online
- Community
- ESRI
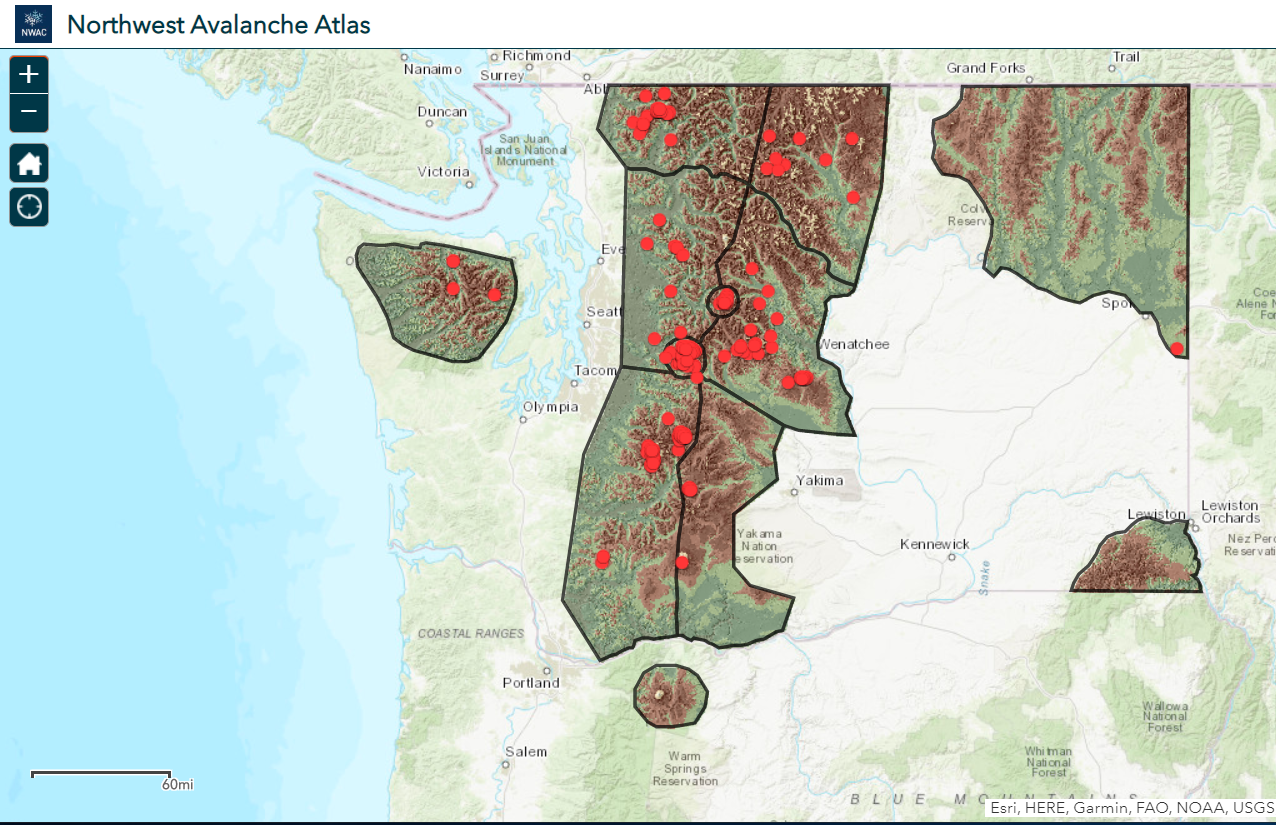
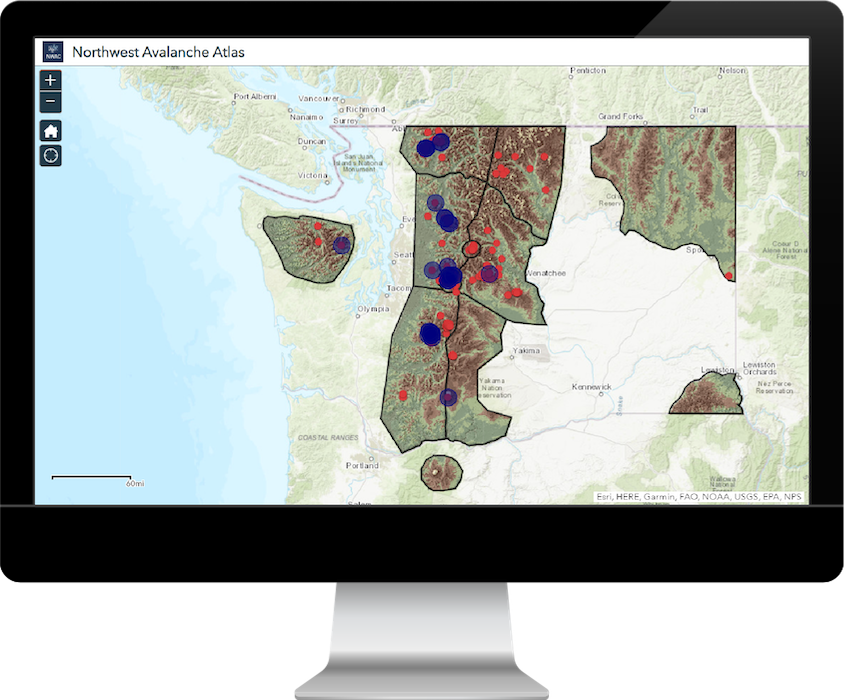
The NWAC Avalanche Atlas indicates where the local skiable regions are as well as where there have been avalanche incidents within that area.
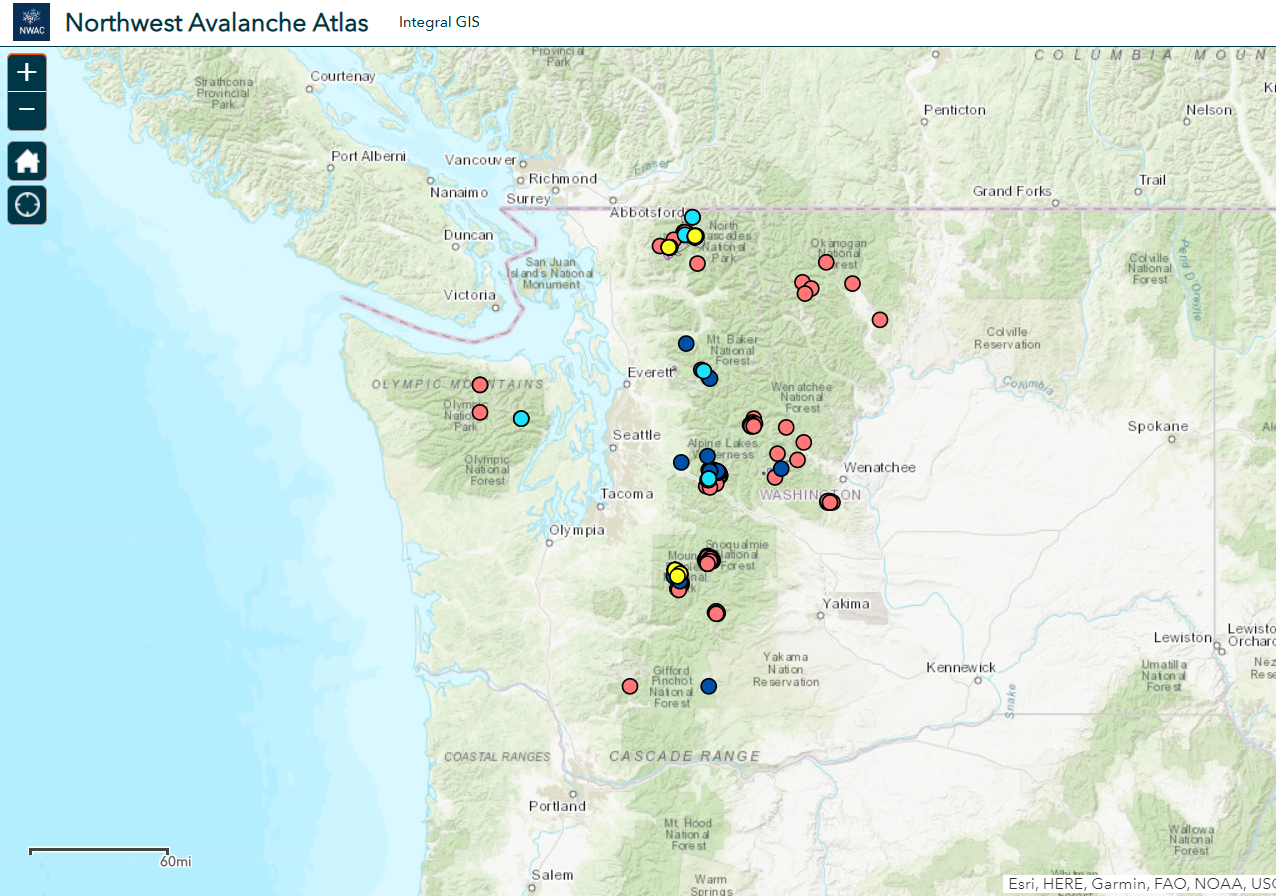
Using the legend as reference, users can view were different types of avalanches have occurred.

The challenge was to be able to view all the avalanche incidences and data collected over the past 60 years.
The Northwest Avalanche Atlas for NWAC
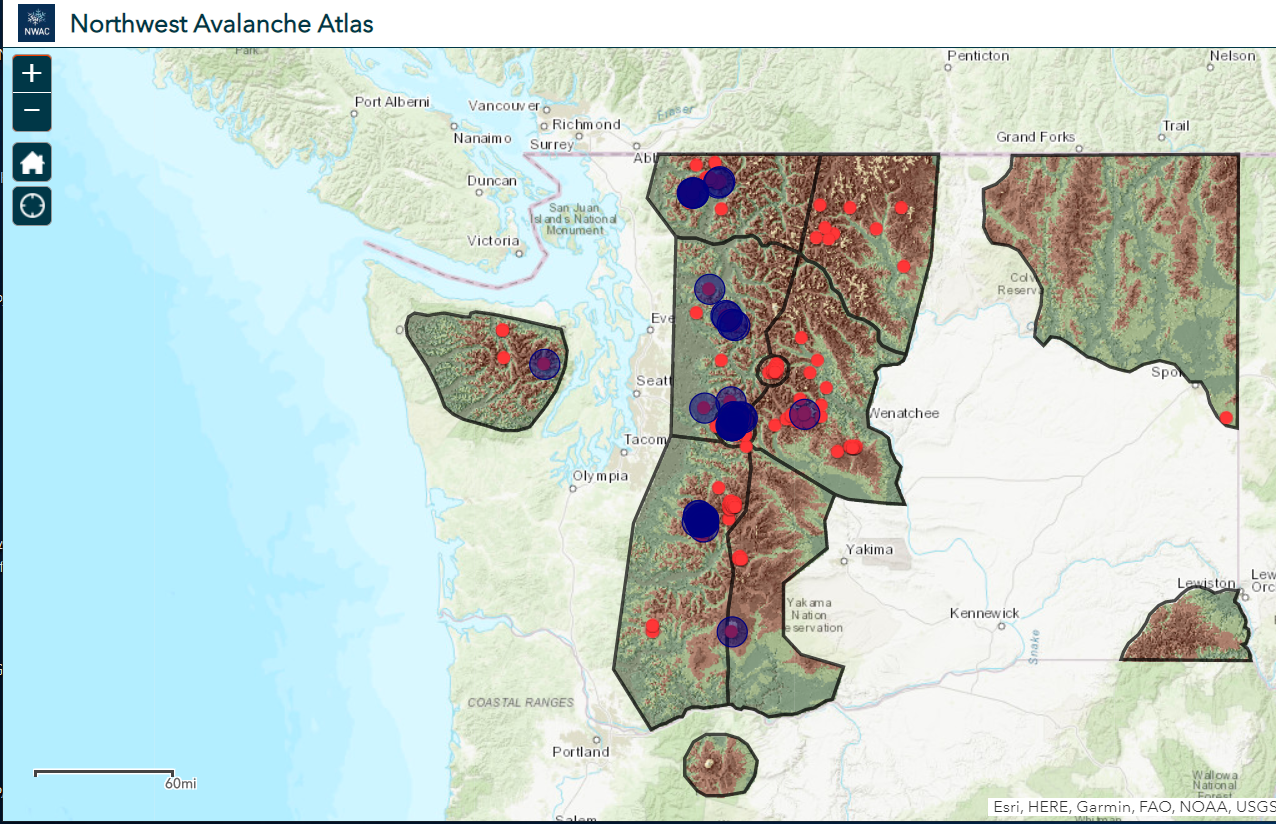
The Avalanche Viewing and Reporting Tool allows users to add their own avalanche data to the map.
The Results
The Avalanche Viewing and Reporting Tool is an ArcGIS Online Web App Tool interface that gives users the ability to draw and store ATES (Avalanche Terrain Expose Scale) polygons. It uses topological USGS and CalTopo basemaps as guides, as well as visualizes, queries, and filters avalanche incidences. These ATES polygons display as a feature layer to the Northwest Avalanche Atlas. The Web App includes a Geo Form (the Avalanche Reporting Tool) that allows users to fill out avalanche report data. Once submitted, the report data is shown on the map as a point and is stored in an ArcGIS managed relational geodatabase.Explore our related projects