Redistricting Story Map
League of Women Voters
The Challenge
How can we provide the community with an interactive means of learning more about the redistricting process? The League of Women Voter of Washington, in conjunction with Politics of the Possible in Action, reached out to Integral GIS for assistance to create a set of legal redistricting maps that represent the demographics and reflect the will of the people of Washington State.
Our Insight
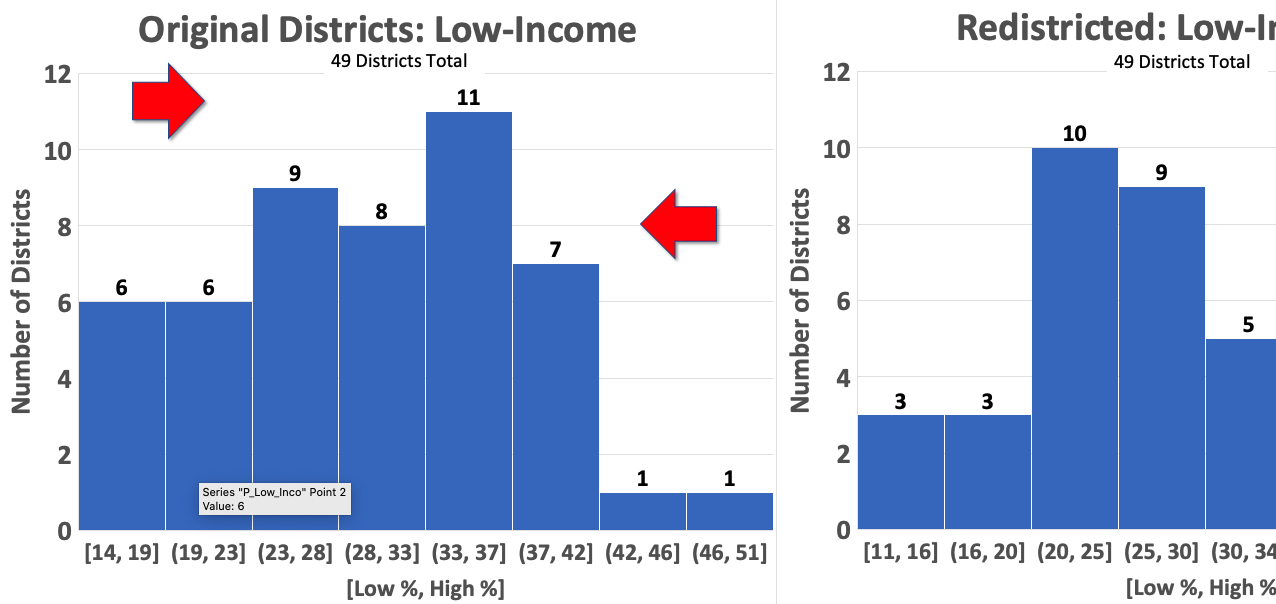
The goal of The Washington Redistricting Lenses Project was to use demographic data and first principles to help us create maps that would balance the desires of many disparate groups.
Our Approach
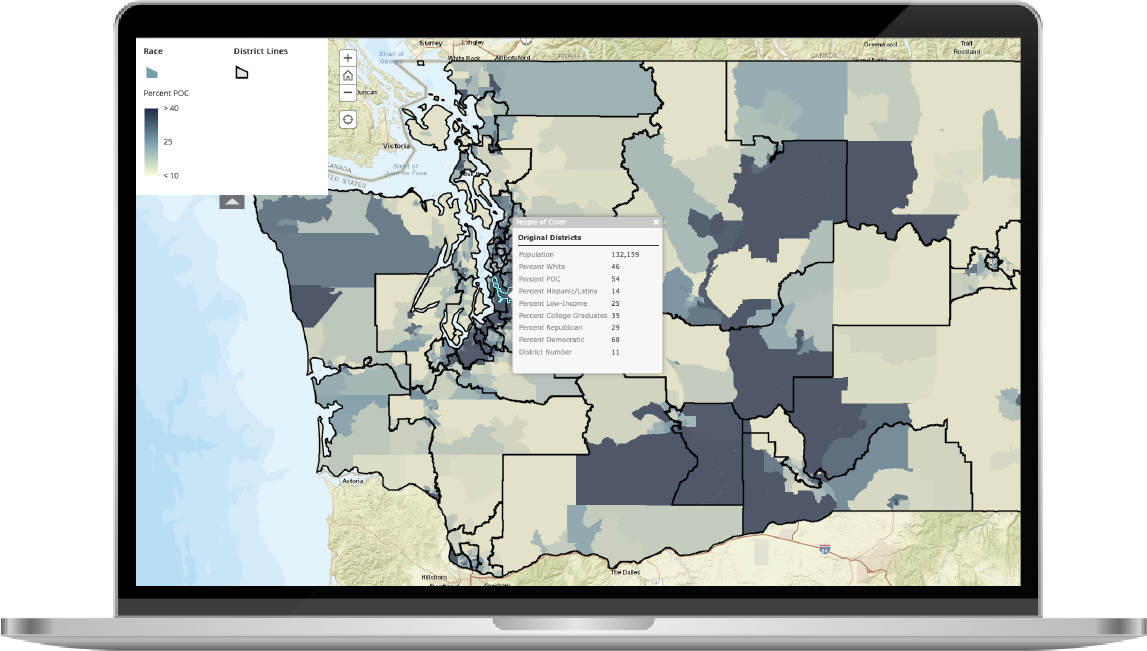
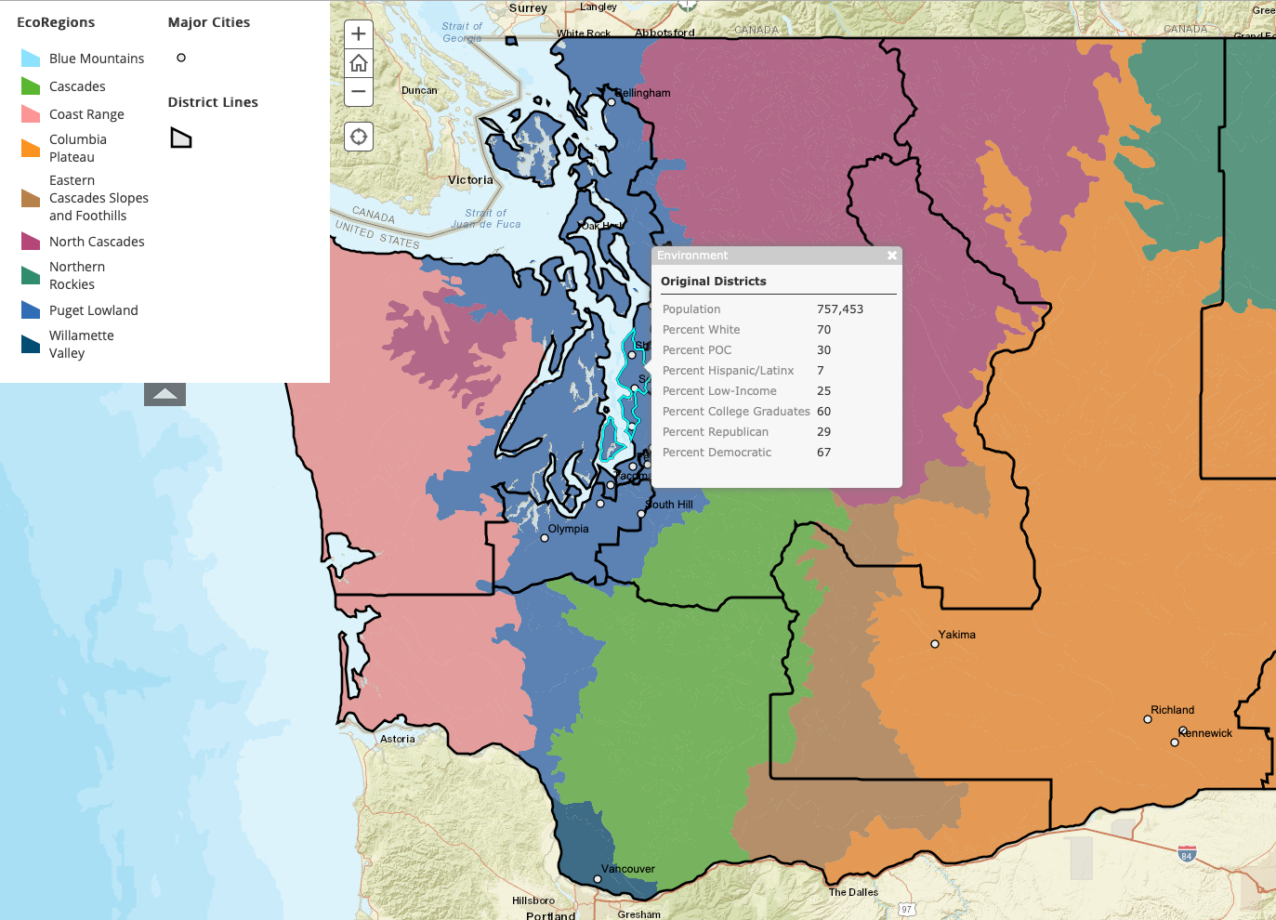
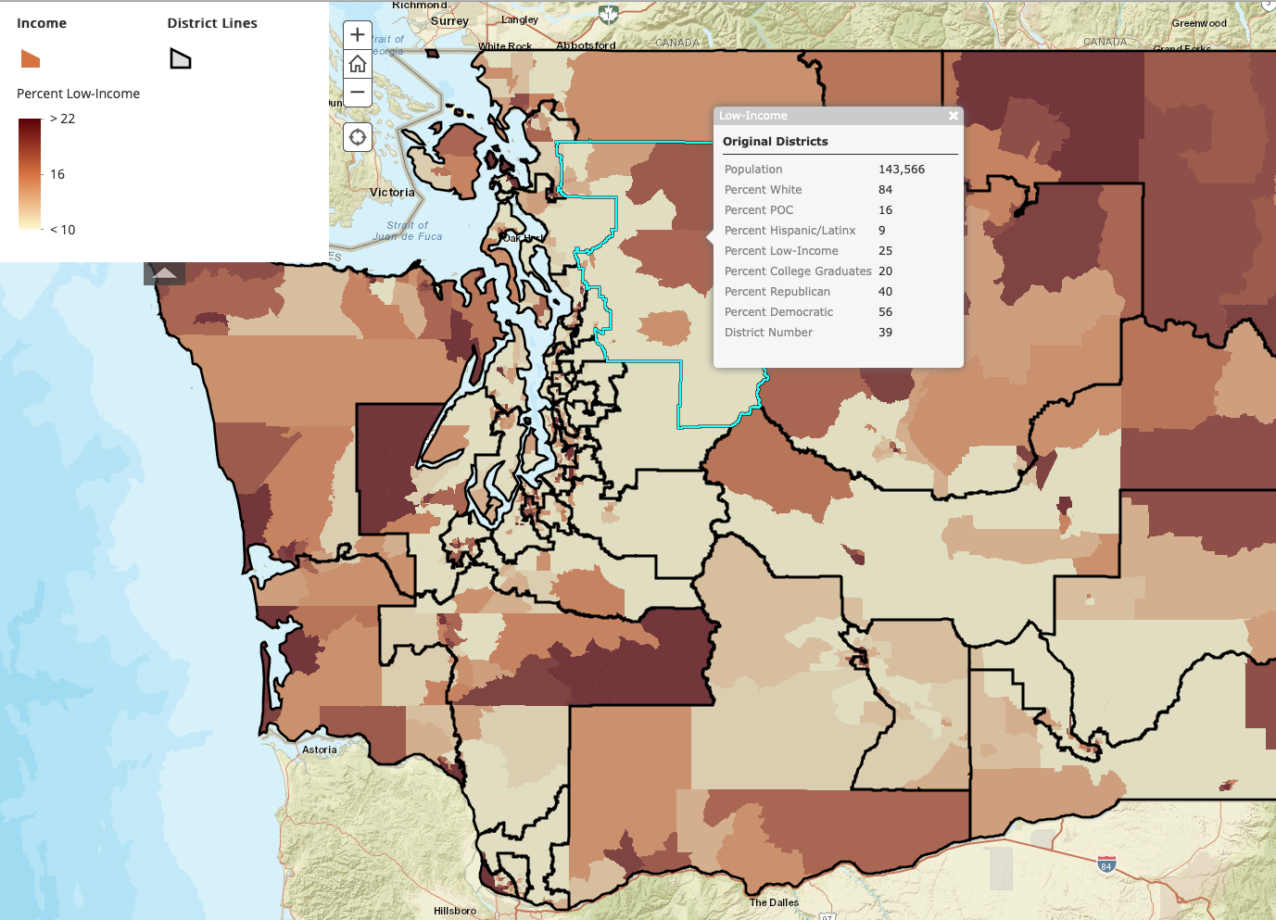
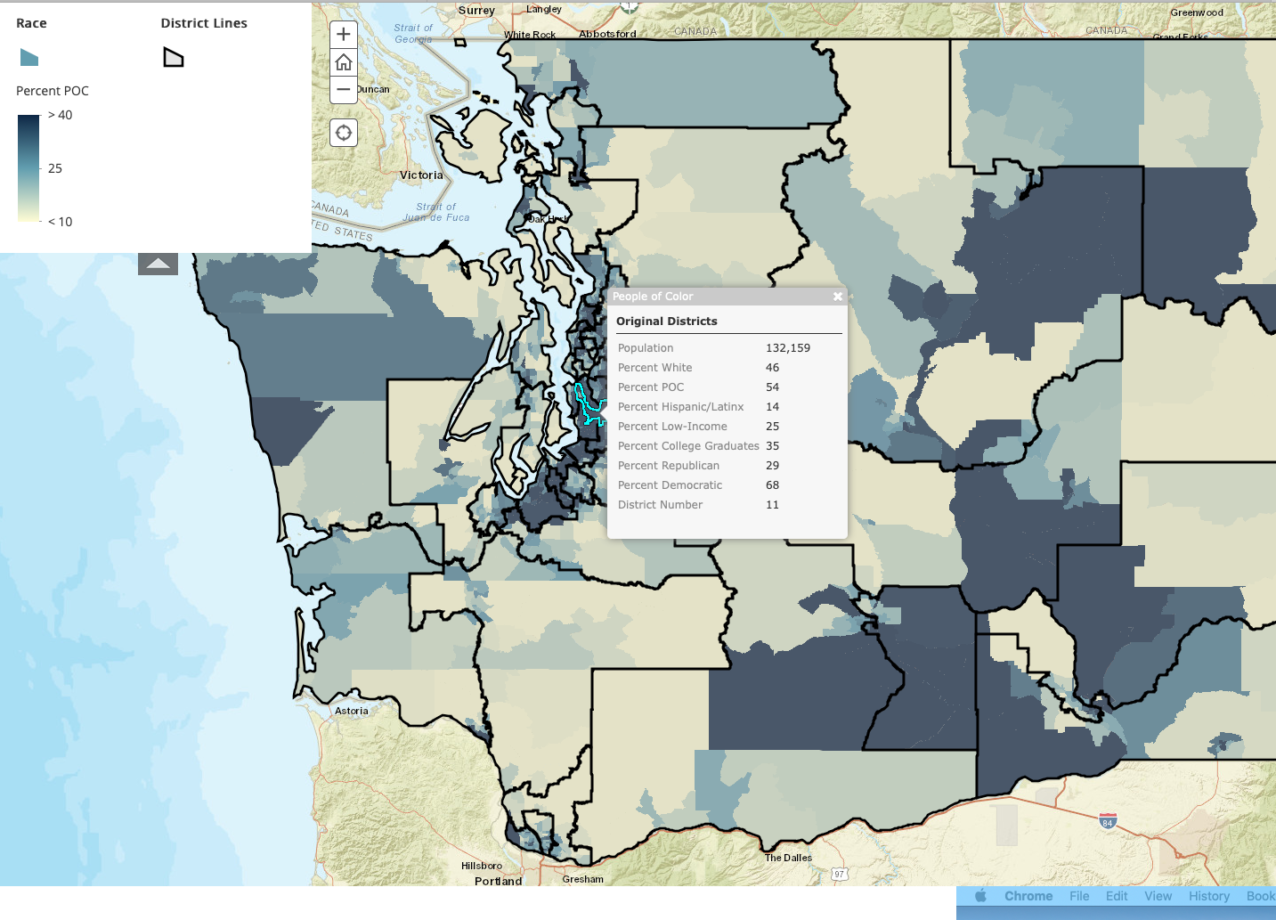
We felt that using ArcGIS Online Story Maps would be the optimal interface for this project. Integral GIS, along with help from the LWV, collected data from the most recent American Community Survey (ACS, 2017) and selected the categories that best described the lens we were illustrating. The project looked at five data lenses based on extensive community discussions: Race/Ethnicity, Household Income, Tribal Affiliations, Environment, and Industry Employment.
Categories
- ArcGIS Online
- Community
- ESRI
The Results
The Washington Redistricting Lenses Story Map showcases information about the complex redistricting process and its implications on socio-demographics in the state.Explore our related projects